

By The Commonwealth Fund
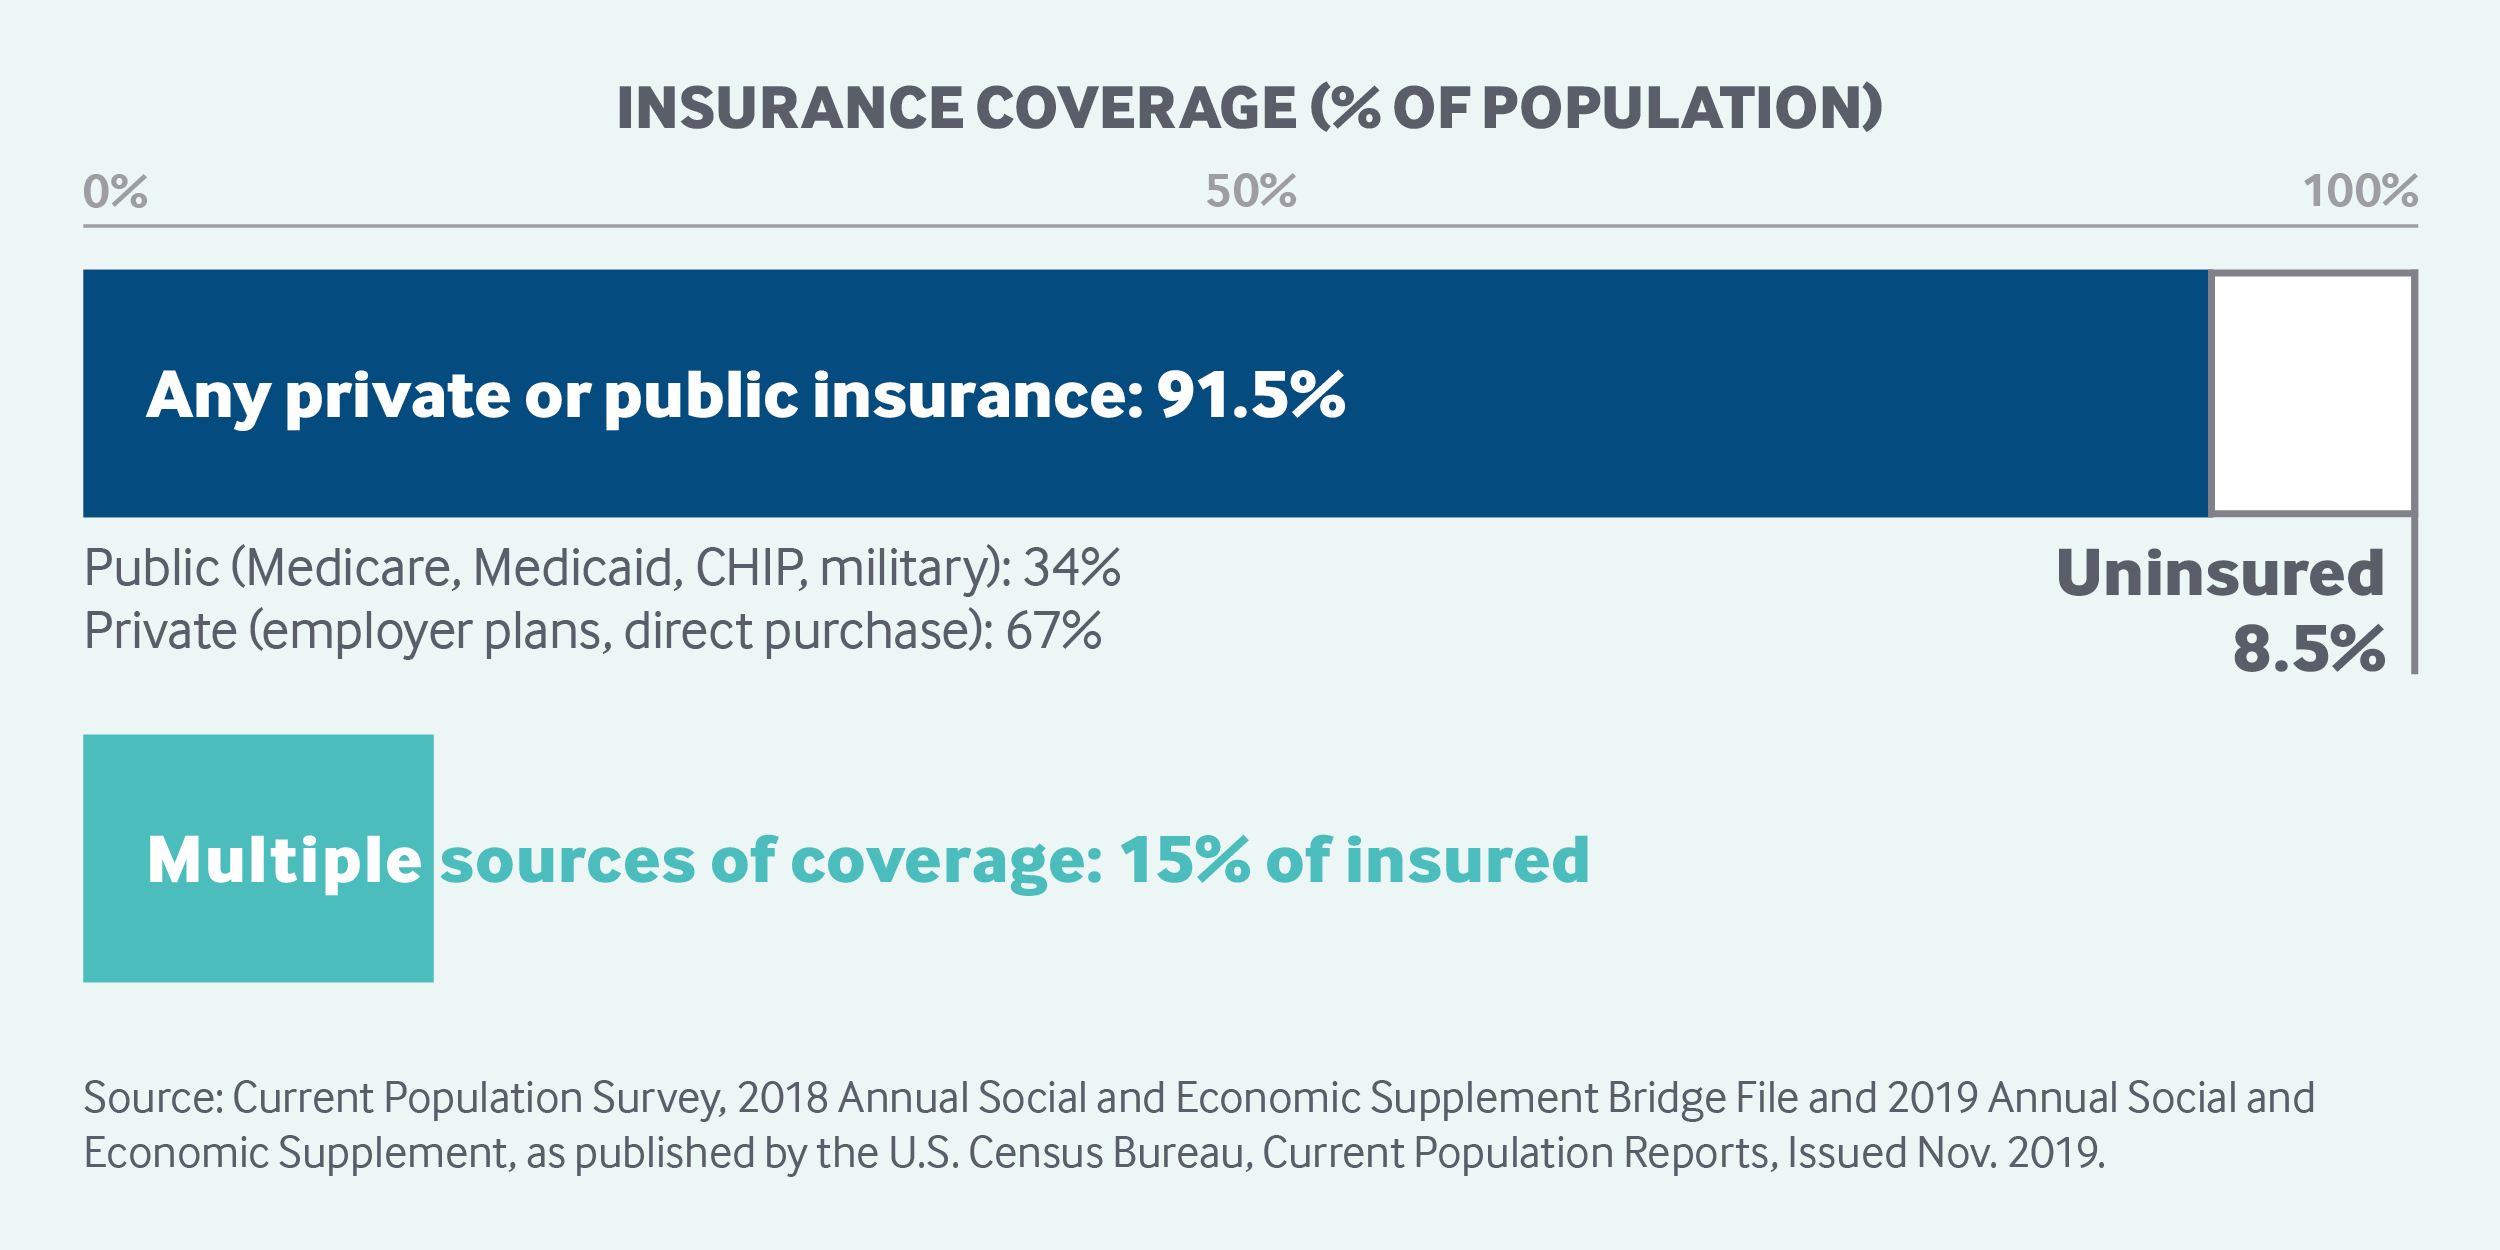
The U.S. health system is a mix of public and private, for-profit and nonprofit insurers and health care providers. The federal government provides funding for the national Medicare program for adults age 65 and older and some people with disabilities as well as for various programs for veterans and low-income people, including Medicaid and the Children’s Health Insurance Program. States manage and pay for aspects of local coverage and the safety net. Private insurance, the dominant form of coverage, is provided primarily by employers. The uninsured rate, 8.5 percent of the population, is down from 16 percent in 2010, the year that the landmark Affordable Care Act became law. Public and private insurers set their own benefit packages and cost-sharing structures, within federal and state regulations.
Sections
How does universal health coverage work?
The United States does not have universal health insurance coverage. Nearly 92 percent of the population was estimated to have coverage in 2018, leaving 27.5 million people, or 8.5 percent of the population, uninsured.1 Movement toward securing the right to health care has been incremental.2
Employer-sponsored health insurance was introduced during the 1920s. It gained popularity after World War II when the government imposed wage controls and declared fringe benefits, such as health insurance, tax-exempt. In 2018, about 55 percent of the population was covered under employer-sponsored insurance.3
In 1965, the first public insurance programs, Medicare and Medicaid, were enacted through the Social Security Act, and others followed.
Medicare. Medicare ensures a universal right to health care for persons age 65 and older. Eligible populations and the range of benefits covered have gradually expanded. In 1972, individuals under age 65 with long-term disabilities or end-stage renal disease became eligible.
All beneficiaries are entitled to traditional Medicare, a fee-for-service program that provides hospital insurance (Part A) and medical insurance (Part B). Since 1973, beneficiaries have had the option to receive their coverage through either traditional Medicare or Medicare Advantage (Part C), under which people enroll in a private health maintenance organization (HMO) or managed care organization.
In 2003, Part D, a voluntary outpatient prescription drug coverage option provided through private carriers, was added to Medicare coverage.
Medicaid. The Medicaid program first gave states the option to receive federal matching funding for providing health care services to low-income families, the blind, and individuals with disabilities. Coverage was gradually made mandatory for low-income pregnant women and infants, and later for children up to age 18.
Today, Medicaid covers 17.9 percent of Americans. As it is a state-administered, means-tested program, eligibility criteria vary by state. Individuals need to apply for Medicaid coverage and to re-enroll and recertify annually. As of 2019, more than two-thirds of Medicaid beneficiaries were enrolled in managed care organizations.4
Children’s Health Insurance Program. In 1997, the Children’s Health Insurance Program, or CHIP, was created as a public, state-administered program for children in low-income families that earn too much to qualify for Medicaid but that are unlikely to be able to afford private insurance. Today, the program covers 9.6 million children.5 In some states, it operates as an extension of Medicaid; in other states, it is a separate program.
Affordable Care Act. In 2010, the passage of the Patient Protection and Affordable Care Act, or ACA, represented the largest expansion to date of the government’s role in financing and regulating health care. Components of the law’s major coverage expansions, implemented in 2014, included:
-
requiring most Americans to obtain health insurance or pay a penalty (the penalty was later removed)
-
extending coverage for young people by allowing them to remain on their parents’ private plans until age 26
-
opening health insurance marketplaces, or exchanges, which offer premium subsidies to lower- and middle-income individuals
-
expanding Medicaid eligibility with the help of federal subsidies (in states that chose this option).
The ACA resulted in an estimated 20 million gaining coverage, reducing the share of uninsured adults aged 19 to 64 from 20 percent in 2010 to 12 percent in 2018.6
Role of government: The federal government’s responsibilities include:
-
setting legislation and national strategies
-
administering and paying for the Medicare program
-
cofunding and setting basic requirements and regulations for the Medicaid program
-
cofunding CHIP
-
funding health insurance for federal employees as well as active and past members of the military and their families
-
regulating pharmaceutical products and medical devices
-
running federal marketplaces for private health insurance
-
providing premium subsidies for private marketplace coverage.
The federal government has only a negligible role in directly owning and supplying providers, except for the Veterans Health Administration and Indian Health Service. The ACA established “shared responsibility” among government, employers, and individuals for ensuring that all Americans have access to affordable and good-quality health insurance. The U.S. Department of Health and Human Services is the federal government’s principal agency involved with health care services.
The states cofund and administer their CHIP and Medicaid programs according to federal regulations. States set eligibility thresholds, patient cost-sharing requirements, and much of the benefit package. They also help finance health insurance for state employees, regulate private insurance, and license health professionals. Some states also manage health insurance for low-income residents, in addition to Medicaid.
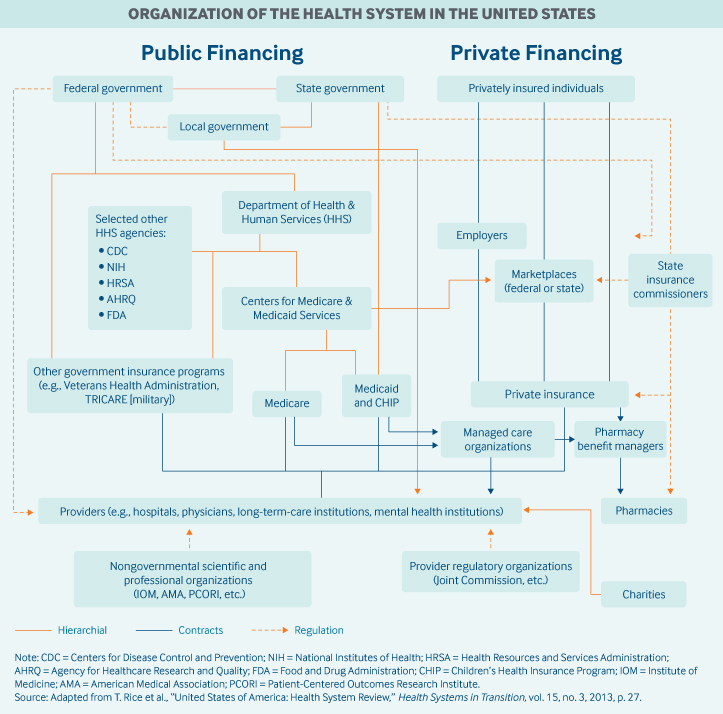
Role of public health insurance: In 2017, public spending accounted for 45 percent of total health care spending, or approximately 8 percent of GDP. Federal spending represented 28 percent of total health care spending. Federal taxes fund public insurance programs, such as Medicare, Medicaid, CHIP, and military health insurance programs (Veteran’s Health Administration, TRICARE). The Centers for Medicare and Medicaid Services is the largest governmental source of health coverage funding.
Medicare is financed through a combination of general federal taxes, a mandatory payroll tax that pays for Part A (hospital insurance), and individual premiums.
Medicaid is largely tax-funded, with federal tax revenues representing two-thirds (63%) of costs, and state and local revenues the remainder.7 The expansion of Medicaid under the ACA was fully funded by the federal government until 2017, after which the federal funding share gradually decreased to 90 percent.
CHIP is funded through matching grants provided by the federal government to states. Most states (30 in 2018) charge premiums under that program.
Role of private health insurance: Spending on private health insurance accounted for one-third (34%) of total health expenditures in 2018. Private insurance is the primary health coverage for two-thirds of Americans (67%). The majority of private insurance (55%) is employer-sponsored, and a smaller share (11%) is purchased by individuals from for-profit and nonprofit carriers.
Most employers contract with private health plans to administer benefits. Most employer plans cover workers and their dependents, and the majority offer a choice of several plans.8,9 Both employers and employees typically contribute to premiums; much less frequently, premiums are fully covered by the employer.
The ACA introduced a federal marketplace, HealthCare.gov, for purchasing individual primary health insurance or dental coverage through private plans. States can also set up their own marketplaces.
More than one in three Medicare beneficiaries in 2019 opted to receive their coverage through a private Medicare Advantage health plan.10
Medicaid beneficiaries may receive their benefits through a private managed care organization, which receives capitated, typically risk-adjusted payments from state Medicaid departments. More than two-thirds of Medicaid beneficiaries are enrolled in managed care.
Services covered: There is no nationally defined benefit package; covered services depend on insurance type:
Medicare. People enrolled in Medicare are entitled to hospital inpatient care (Part A), which includes hospice and short-term skilled nursing facility care.
Medicare Part B covers physician services, durable medical equipment, and home health services. Medicare covers short-term post-acute care, such as rehabilitation services in skilled nursing facilities or in the home, but not long-term care.
Part B covers only very limited outpatient prescription drug benefits, including injectables or infused drugs that need to be administered by a medical professional in an office setting. Individuals can purchase private prescription drug coverage (Part D).
Coverage for dental and vision services is limited, with most beneficiaries lacking dental coverage.11
Medicaid. Under federal guidelines, Medicaid covers a broad range of services, including inpatient and outpatient hospital services, long-term care, laboratory and diagnostic services, family planning, nurse midwives, freestanding birth centers, and transportation to medical appointments.
States may choose to offer additional benefits, including physical therapy, dental, and vision services. Most states (39, as of 2018) provide dental coverage.12
Outpatient prescription drugs are an optional benefit under federal law; however, currently all states provide drug coverage.
Private insurance. Benefits in private health plans vary. Employer health coverage usually does not cover dental or vision benefits.13
The ACA requires individual marketplace and small-group market plans (for firms with 50 or fewer employees) to cover 10 categories of “essential health benefits”:
-
ambulatory patient services (doctor visits)
-
emergency services
-
hospitalization
-
maternity and newborn care
-
mental health services and substance use disorder treatment
-
prescription drugs
-
rehabilitative services and devices
-
laboratory services
-
preventive and wellness services and chronic disease management
-
pediatric services, including dental and vision care.
Cost-sharing and out-of-pocket spending: In 2018, households financed roughly the same share of total health care costs (28%) as the federal government. Out-of-pocket spending represented approximately one-third of this, or 10 percent of total health expenditures. Patients usually pay the full cost of care up to a deductible; the average for a single person in 2018 was $1,846. Some plans cover primary care visits before the deductible is met and require only a copayment.
Out-of-pocket spending is considerable for dental care (40% of total spending) and prescribed medicines (14% of total spending).14
Safety nets: In addition to public insurance programs, including Medicare and Medicaid, taxpayer dollars fund several programs for uninsured, low-income, and vulnerable patients. For instance, the ACA increased funding to federally qualified health centers, which provide primary and preventive care to more than 27 million underserved patients, regardless of ability to pay. These centers charge fees based on patients’ income and provide free vaccines to uninsured and underinsured children.15
To help offset uncompensated care costs, Medicare and Medicaid provide disproportionate-share payments to hospitals whose patients are mostly publicly insured or uninsured. State and local taxes help pay for additional charity care and safety-net programs provided through public hospitals and local health departments.
In addition, uninsured individuals have access to acute care through a federal law that requires most hospitals to treat all patients requiring emergency care, including women in labor, regardless of ability to pay, insurance status, national origin, or race. As a consequence, private providers are a significant source of charity and uncompensated care.
How is the delivery system organized and how are providers paid?
Physician education and workforce: Most medical schools (59%) are public. Median tuition fees in 2019 were $39,153 in public medical schools and $62,529 in private schools. Most students (73%) graduate with medical debt averaging $200,000 (2019), an amount that includes pre-medical education.21 Several federal debt-reduction, loan-forgiveness, and scholarship programs are offered; many target trainees for placement in underserved regions. Providers practicing in designated Health Professional Shortage Areas are eligible for a Medicare physician bonus payment.
Primary care: Roughly one-third of all professionally active doctors are primary care physicians, a category that encompasses specialists in family medicine, general practice, internal medicine, pediatrics, and, according to some, geriatrics. Approximately half of primary care doctors were in physician-owned practices in 2018; more commonly, these are general internists rather than family practitioners.22
Primary care physicians are paid through a combination of methods, including negotiated fees (private insurance), capitation (private insurance and some public insurance), and administratively set fees (public insurance). The majority (66%) of primary care practice revenues come from fee-for-service payments.23 Since 2012, Medicare has been experimenting with alternative payment models for primary care and specialist providers.
Outpatient specialist care: Specialists can work both in private practices and in hospitals. Specialist practices are increasingly integrating with hospital systems, as well as consolidating with each other. The majority of specialists are in group practices, most often in single-specialty group practices.24
Outpatient specialists are free to choose which form of insurance they will accept. For example, not all specialists accept publicly insured patients, because of the relatively lower reimbursement rates set by Medicaid and Medicare. Access to specialists for beneficiaries of these programs—not to mention for people without any insurance—can therefore be particularly limited.
Administrative mechanisms for direct patient payments to providers: Copayments for doctor visits are typically paid at the time of service or billed to the patient afterward. Some insurance plans and products (including health savings accounts) require patients to submit claims to receive reimbursement.
Providers bill insurers by coding the services rendered. There are thousands of codes, making this process time-consuming; providers typically hire coding and billing staff.
Because of administrative hurdles, a small number of providers do not accept any insurance. Instead, they accept only cash payments or require annual or monthly retainer payments to the providers for “concierge medicine,” which offers enhanced access to services.
After-hours care: Primary care physicians are not required to provide or plan for after-hours access for their registered patients. However, in 2019, 45 percent of primary care doctors had after-hours arrangements: 38 percent of these provide care in the evenings and 41 percent on the weekends.25
After-hours care is increasingly provided through walk-in appointments at private urgent-care centers or retail clinics that typically serve younger, healthier individuals who require episodic care and may not have a primary care provider.26
Hospitals: In 2018, 57 percent of the 5,198 short-term acute care hospitals in the U.S. were nonprofit; 25 percent were for-profit; and 19 percent were public (state or local government–owned).27 In addition, there were 209 federal government hospitals.
Hospitals are free to choose which insurance they accept; most accept Medicare and Medicaid. Hospitals are paid through a combination of methods.
-
Medicare pays hospitals through prospective diagnosis-related group (DRG) rates, which do not include physician payments.
-
Medicaid pays hospitals on a DRG, per diem, or cost-reimbursement basis,28 and states have considerable discretion in setting hospital payment rates.
-
Private insurers pay hospitals usually on a per diem basis, typically negotiated between each hospital and its insurers on an annual basis.
Mental health care: Services are provided by both generalists and specialists—including primary care physicians, psychiatrists, psychologists, social workers, and nurses—with the majority delivered in an outpatient setting. Providers are mostly private (nonprofit and for-profit), with some public providers, including public mental health hospitals, Veterans Affairs providers, and federally qualified health centers.
The federal Substance Abuse and Mental Health Services Administration provides states with grants, including Mental Health Block Grants, that fund community mental health services. State and local governments provide additional funding.
The ACA mandated that marketplace insurers provide coverage of mental health and substance use conditions as an essential health benefit. The law also requires all private insurers, including employer-sponsored plans, to provide the same level of benefits for mental and physical health conditions.
Some individuals with serious, long-term mental illnesses qualify for Medicare before age 65. Otherwise, Medicaid is the single largest source of funding for mental health services in the country.29 Many employer-sponsored plans and some state Medicaid programs provide benefits through carve-out contracts with managed behavioral health care organizations.30
Long-term care and social supports: There is no universal coverage for long-term care services. Public spending represents approximately 70 percent of total spending on long-term care services, with Medicaid accounting for the majority.31 Medicare and most employer-sponsored plans cover only post–acute care services following hospitalization, including hospice, short-term nursing services, and short-term nursing home stays (up to 100 days following acute hospitalization).
Private long-term care insurance is available but rarely purchased; private insurance represented only 7.5 percent of total long-term care spending in 2016.
The ACA originally included the Community Living Assistance Services and Supports Act, which would have created a universal, voluntary, public long-term care insurance option for employed persons. However, the program was deemed unworkable and was repealed in 2013.
What are the major strategies to ensure quality of care?
The ACA required the U.S. Department of Health and Human Services to establish a National Quality Strategy,32 a set of national aims and priorities to guide local, state, and national quality improvement efforts, supported by partnerships with public and private stakeholders. The strategy includes annual reporting on a selected set of quality measures.33
Since 2003, the Agency for Healthcare Research and Quality has published the annual National Healthcare Quality and Disparities Report, which reports on national progress in health care quality improvement. The 2018 report found that the quality of U.S. health care had improved overall from 2000 to 2016, but that improvement was inconsistent. For example, while most person-centered care and patient-safety measures improved, affordability did not.34
Federal law requires certain providers to report data on the quality of their care, and the Centers for Medicare and Medicaid Services to publicly report performance on quality measures. For example, Hospital Compare is an online public resource summarizing the performance of more than 4,000 hospitals on measures of care processes, care outcomes, and patient experiences. Related quality-reporting programs include Nursing Home Compare and Physician Compare.
The Healthcare Effectiveness Data and Information Set is one of the most widely used tools for rating provider quality. It is used by health plans to rate provider quality. The set includes rates of cancer screenings, medication management for chronic conditions, follow-up visits, and other metrics. The nonprofit National Quality Forum builds consensus on national performance measurement and priorities, including the submission of recommendations for measures to be used in Medicare.
What is being done to reduce disparities?
Several federal agencies are tasked with monitoring and reducing disparities. The Agency for Healthcare Research and Quality publishes an annual national report highlighting disparities in health care quality by race/ethnicity, age, and sex. According to the latest report, disparities related to income and race persist but grew smaller between 2000 and 2016.35 African Americans, American Indians, Alaska Natives, Native Hawaiians, and Pacific Islanders received worse care than whites according to about 40 percent of quality measures. Hispanics and Asian Americans received worse care per 35 percent and 28 percent of measures, respectively. Disparities for poor and uninsured populations are also persisting in major priority areas for quality.
Certain federal offices have specific responsibilities related to reducing disparities:
-
The Office of Minority Health is tasked with developing policies and programs to eliminate disparities among racial and ethnic minority groups.
-
The Health Resources and Services Administration is tasked with providing grants to states, local governments, and community-based organizations for care and treatments for low-income, uninsured, or other vulnerable populations, including specific programs targeting individuals with HIV/AIDS, mothers and children (through the Maternal and Child Health Bureau), and rural or remote populations.36 The agency also houses the Office of Health Equity, which works to reduce health disparities.
-
The Indian Health Service serves 2.6 million American Indians and Alaska Natives who belong to more than 500 federally recognized tribes in 37 states. The service is fully funded through the federal government.
The ACA created a legal requirement for nonprofit hospitals, which are exempt from paying certain taxes because of their charitable status, to conduct community health needs assessments together with community stakeholders to identify and address unmet health needs in their communities. This requirement is enforced through the Internal Revenue Service, and reporting must be made available to the public.37
What is being done to promote delivery system integration and care coordination?
The ACA introduced several levers to improve the coordination of care among medical/clinical providers in the largely specialist-driven health care system. For example, the law supported adoption of the “patient-centered medical home” model, which emphasizes care continuity and coordination via primary care, as well as evidence-based care, expanded access, and prevention and chronic care management.
The ACA also expanded the Centers for Medicare and Medicaid Services’ ability to test alternative payment models that reward quality, reduce costs, and aim to improve care coordination. This trend has since been continued by public and private payers.
One of these alternative payment models is “bundled payments,” whereby a single payment is made for all the services delivered by multiple providers for a single episode of care. Another trend is the proliferation of accountable care organizations (ACOs). These networks of providers assume contractual responsibility for providing a defined population with care that meets quality targets. Providers in ACOs share in the savings that constitute the difference between forecasted and actual health care spending.
As of 2019, there were more than 1,000 ACOs in the public and private markets, covering 32.7 million people. Of these ACOs, 558 are Medicare ACOs, serving 12.3 million beneficiaries who are free to seek services from any Medicare provider, including those outside their designated ACO.38,39,40 There are many variants of the Medicare ACO: The most popular is a permanent program written into the ACA, the Medicare Shared Savings Program, which serves nearly one-third of all Medicare beneficiaries. To improve coordination, ACOs are implementing programs that include medication management, prevention of emergency department visits and hospital readmissions, and management of high-need, high-cost patients.
What is the status of electronic health records?
The Office of the National Coordinator for Health Information Technology, created in 2004, is the principal federal entity charged with the coordination of nationwide efforts to implement and advance the use of health information technology and the electronic exchange of health infor-mation. In 2017, an estimated 96 percent of nonfederal acute care hospitals and 86 percent of office-based physicians had adopted a “certified” electronic health record (EHR) system. Eighty percent of hospitals and 54 percent of physician offices had adopted an EHR with advanced ca-pabilities, such as the ability to track patient demographics, list medications, store clinician notes, and track medication orders, laboratory tests, and imaging results.41,42
The 21st Century Cures Act, passed in 2016 to promote the use of EHRs overall, requires that all health care providers make electronic copies of patient records available to patients, at their request, in machine-readable form.
How are costs contained?
Annual per capita health expenditures in the United States are the highest in the world (USD $11,172, on average, in 2018), with health care costs growing between 4.2 percent and 5.8 percent annually over the past five years.43
Private insurers have introduced several demand-side levers to control costs, including tiered provider pricing and increased patient cost-sharing (for example, through the recent proliferation of high-deductible health plans). Other levers include price negotiations, selective provider contracting, risk-sharing payments, and utilization controls.
The federal government controls costs by:
-
setting provider rates for Medicare and the Veterans Health Administration
-
capitating payments to Medicaid and Medicare managed care organizations
-
capping annual out-of-pocket fees for beneficiaries enrolled in Medicare Advantage plans and individuals enrolled in marketplace/exchange plans
-
negotiating drug prices for the Veterans Health Administration.
However, since most Americans have private health insurance, there are limited options available to the federal government. The ACA introduced cost-control levers for private insurers offering marketplace coverage, requiring that insurers planning to significantly increase plan premiums submit their prospective rates to either the state or the federal government for review.
State governments try to control costs by regulating private insurance, setting Medicaid provider fees, developing preferred-drug lists, and negotiating lower drug prices for Medicaid. Maryland and Massachusetts estimate total statewide health expenditures and set annual growth benchmarks for health care costs across payers. In those states, health care entities are required to implement performance improvement plans if they do not meet the benchmark.
Attempts to contain pharmaceutical spending are limited to a few mechanisms:
-
The prices private health plans pay for prescription drugs are based on formularies.
-
Pharmacy benefit managers are tasked with negotiating drug prices and rebates with manufacturers on behalf of private insurers.
-
Volume-based rebates are commonly used by payers and manufacturers to offset the prices of drugs with therapeutic substitutes.
-
Prior authorizations and step therapy encourage the use of lower-cost alternatives.
Among public payers, the Veterans Health Administration receives the deepest discounts for medicines. The agency is legally entitled to a minimum 24 percent discount from the nonfederal average manufacturer price and can choose to negotiate deeper discounts with manufacturers. Medicaid also is legally entitled to a discounted price and can negotiate further discounts.44 Medicare, the largest buyer of prescription drugs, does not negotiate drug costs with manufacturers.
What major innovations and reforms have recently been introduced?
Medicare and Medicaid Innovations. The Affordable Care Act ushered in sweeping insurance and health system reforms aimed at expanding coverage, addressing affordability, improving quality and efficiency, lowering costs, and strengthening primary and preventive care and public health. The most important engine for innovation is the new Center for Medicare and Medicaid Innovation. The ACA allocated $10 billion over 10 years to the agency with the mandate to conduct research and development that can improve the quality of Medicare and Medicaid services, reduce their costs, or both.
If initiatives undertaken by the Center for Medicare and Medicaid Innovation are certified by federal actuaries as improving quality of care at the same cost—or maintaining quality while reducing health care costs—the U.S. Secretary of Health and Human Services has the authority to spread these initiatives, without congressional approval, throughout the Medicare and Medicaid programs.
The Trump administration has rolled out several other changes to the Medicare and Medicaid programs. These include the 2019 announcement of Primary Care First, a new voluntary payment model intended for launch in 2021 that aims to simplify primary care physician payments. In addition, since 2018, several states have instated a requirement for able-bodied individuals to document that they are meeting minimum work requirements to qualify for or keep their Medicaid coverage.
Changes to the Affordable Care Act. As of 2020, most of the ACA’s provisions remain the law of the land. However the Trump administration has canceled some consumer protections through regulatory and executive actions. For example, in 2019, the individual mandate, the financial penalty for not having health insurance, was removed. In addition, through executive orders enacted in 2017 and 2018, the administration allowed states to offer alternative, lower-cost, minimally regulated insurance plans in their marketplaces that do not meet the minimum requirements of the ACA.
Cost Control Initiatives. The administration has also announced efforts to address high health care prices, especially concerning prescription drugs. Two bills passed in 2018 banned so-called “gag clauses” in contracts between pharmacies and pharmacy benefit managers. These clauses prevented pharmacists from informing customers when the cash price (without billing insurance) for a drug is lower than the insurance-negotiated price. In addition, to address hospital price transparency, federal rules require all hospitals to post their charges for medical procedures online and update the list at least once a year.
The past few years have also seen employers, which provide health insurance for approximately half of Americans, taking strides to lower health care costs by eliminating “middleman” agents—such as insurance companies and pharmaceutical benefit managers—from the health care financing chain. Some larger employers have joined with others to form their own nonprofit health care corporations, with the joint venture between Amazon, Berkshire Hathaway, and J.P. Morgan being one prominent example.45 Other firms, such as Apple, are hiring providers directly to deliver care to their employees at on-site health clinics.46